
As we get close to the end of a great 2017, we're continuing to put our heads down and work on supporting the data our customers need to better understand their research participants. Over the last few months we've been working hard to bring a new data set from Fitbit into Fitabase. Starting this week, you'll notice a brand new option when viewing individual participant report pages and in our batch export tool: support for Activity Log data export.
What's an activity log?
Activity logs are records of specific activities that a Fitbit user (participant) completed through one of five different methods.
- Auto-detected activities that are recognized through Fitbit's SmartTrack feature.
- Activities initiated from the tracker such as runs, walks, hikes, or workouts.
- Manually created activities created by the user via the Fitbit mobile app or web dashboard.
- Runs, walks, or hikes created using the MobileRun (phone GPS) feature within the Fitbit mobile app.
- Workouts completed while using the FitStar (now called Fitbit Coach) workout app.
What data is available?
When an activity event is created by one of the methods described above and the Fitbit device syncs, we bring in a detailed data set that describes the activity. This includes information about:
- Date and time activity started
- Duration of the activity
- Activity type
- Activity creation method
- Distance of the activity (only available in certain scenarios)
- Elevation gained during the activity (when wearing a tracker that supports floors).
- Estimated energy expenditure during the activity.
- Minutes spent in different intensity categories during the activity
- Average heart rate during the activity (if wearing a heart rate tracker).
- Minutes spent in different heart rate zones during the activity (if wearing a heart rate tracker).
What can I do with this data?
Great question! Many of the newest Fitbit devices including the Flex 2, Alta, Alta HR, Charge 2, Blaze, and Ionic support Fitbit's SmartTrack feature for auto-detection of activities. SmartTrack allows you to set a time threshold for auto-detection of each activity, with a minimum of 10 minutes, and a maximum threshold of 90 minutes. By default, all SmartTrack activity duration thresholds are set to 15 minutes. If you never touch the defaults, and you have one of the aforementioned devices, you can use our Activity Log export to better understand your participant's activity behavior. For instance, you can understand the number of walks a participant completed during an intervention. Or, you can see how participants engage in various activities such as running, cycling, and hiking over time, identifying patterns and developing insights about how intense those activities are.
Do you have an example?
We wouldn't be a good data-driven platform unless we explore our own data, and the new activity logs are no exception. I exported 61 days of activity log data (from October 1 to November 30, 2017) to see what I can understand about my own activities.
Between 10/1/2017 and 11/30/2017 I completed:
- 53 Walking Activities,
- Total walking time: 1499.68 minutes
- Mean walking activity duration: 28.30 minutes
- Average heart rate during walking activities: 102.77 bpm
- Minutes of MVPA from walking activities: 1187
- 4 Running Activities
- Total running time: 135.40 minutes
- Mean running activity duration: 33.85 minutes
- Average heart rate during running activities: 147.75 bpm
- Minutes of MVPA from running activities: 124
- 3 Hiking Activities
- Total hiking time: 294.01
- Mean hiking activity duration: 98 minutes
- Average heart rate during hiking activities: 119.67 bpm
- Minute of MVPA from hiking activities: 278
- 1 FitStar Workout
- Total FitStar Workout time: 6.17 minutes
- Mean FitStar activity duration: 6.17 minutes
- Average heart rate during FitStar activities: 96 bpm
- Minute of MVPA from FitStar activities: 0
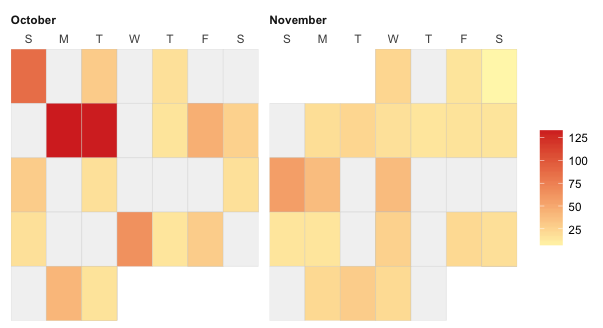
You can also use this data to do some fun things with data visualization to better understand patterns of activities over time. For instance, I created this simple calendar heat map to show when activities took place, and how many minutes of activities were tracked per day.
Note: You can access this example data, along with many other example data sets in our new knowledge base.
We can't wait to see what you do with Activity Log data. If you have questions about this data don't hesitate to get in touch!